| caution The following content has been published in the past. In other words, they are old contents. Please refer to the latest version. This information is for reference only. Click here for the latest contents. |
Purpose of this site
NEW
Quoted from wikipedia
|
Researcher and presenter
They came from the world of “online picture books mogura-no-mogu.jp”
|
|||||||
 |
Professor Papamogu
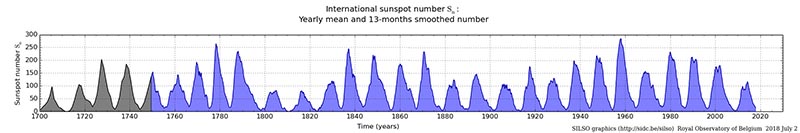
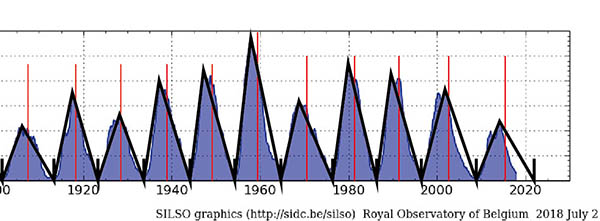
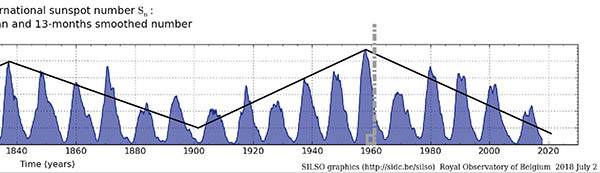
International Sunspot nunber : Free dataQuoted from SILSO
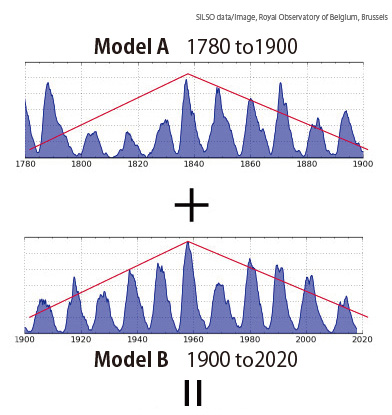
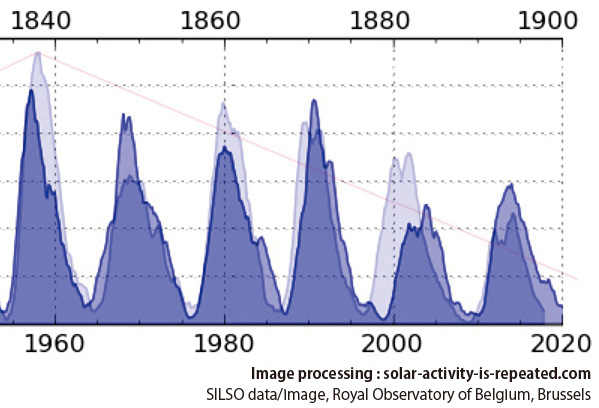
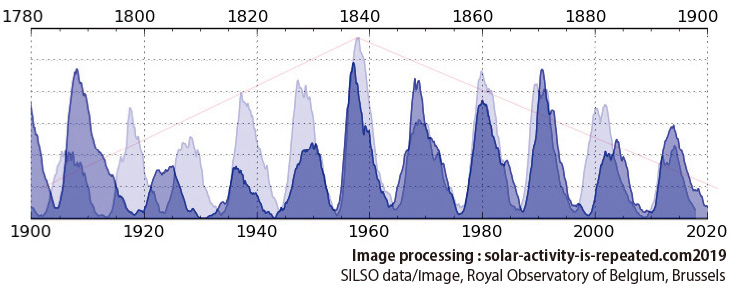
Superimpose the two data.
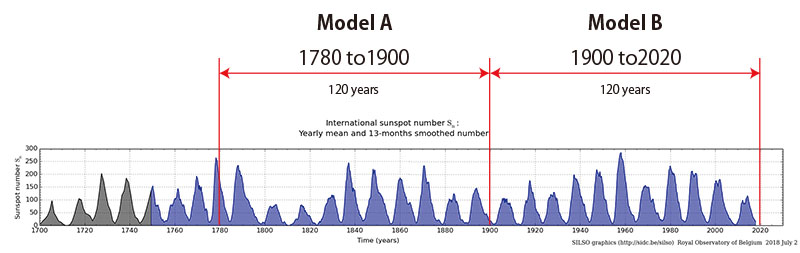
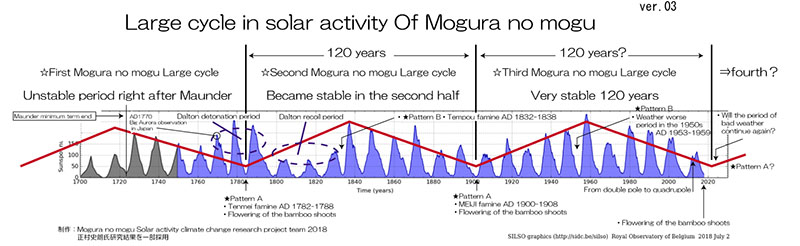
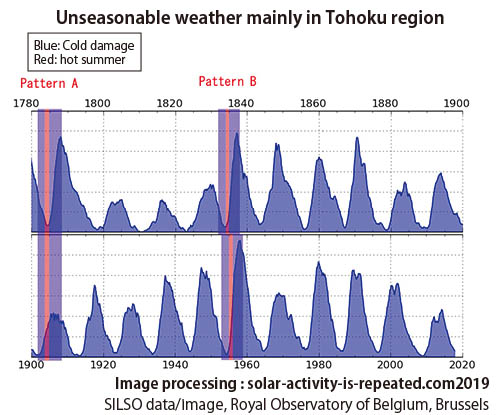
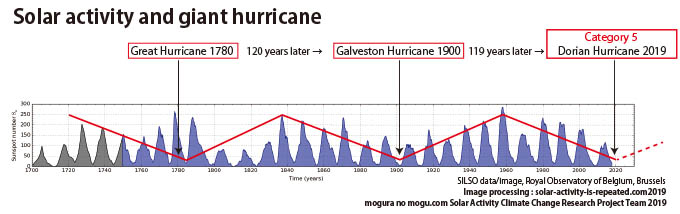
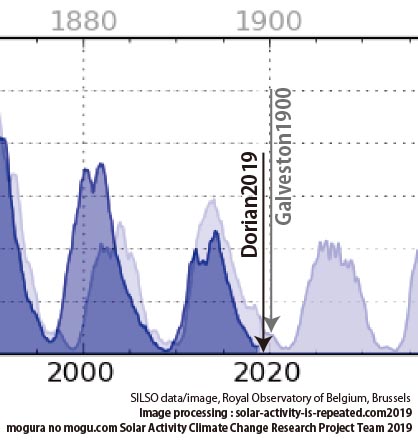
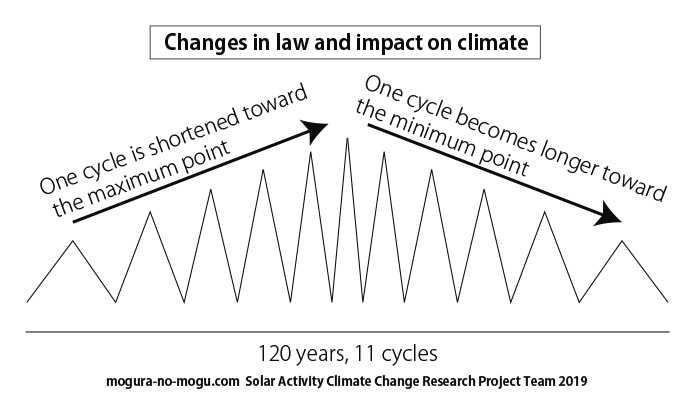
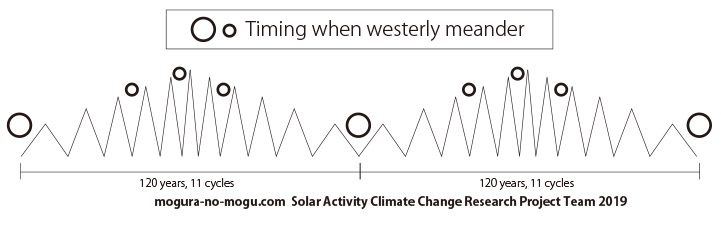
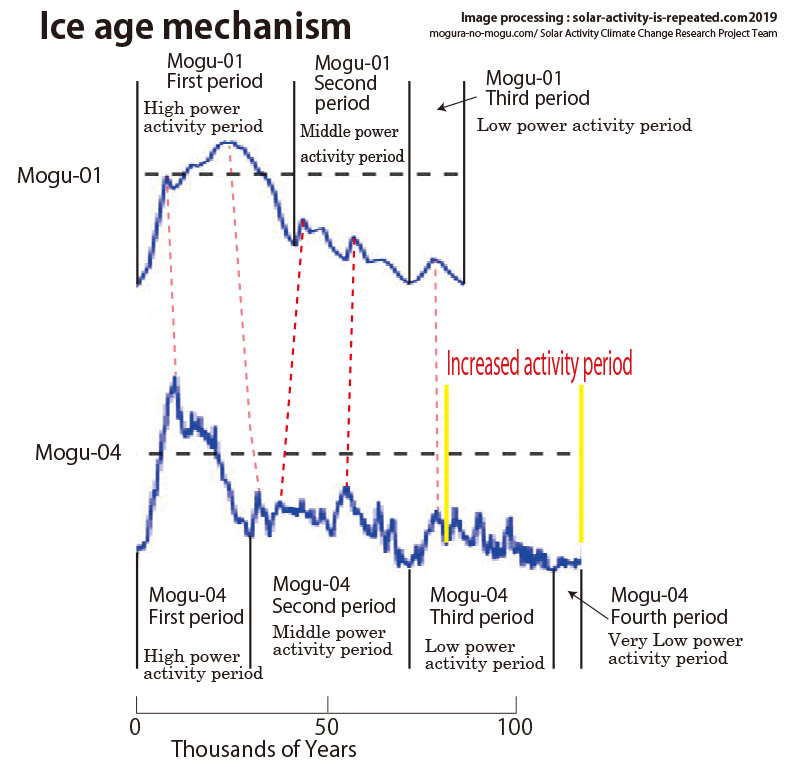
Solar activity repeats every 120 years.
Partially enlarged image
Whole image
This discovery has been reported to SILSO.February 22, 2019
|
Dr. Kaerusan
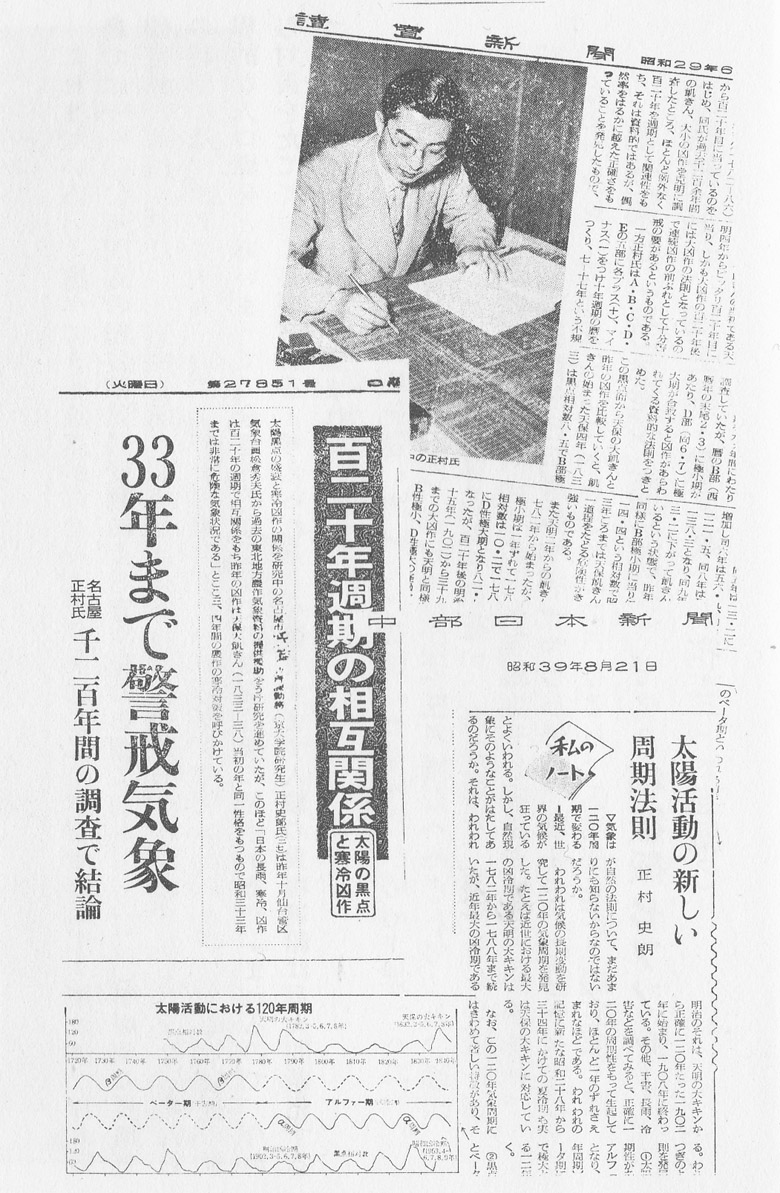
This fact was reported in the Japanese major newspaper in the 1950s.Kero.
Mr. Shiro Masamura's presentation manuscript, Kyoto University server storage data
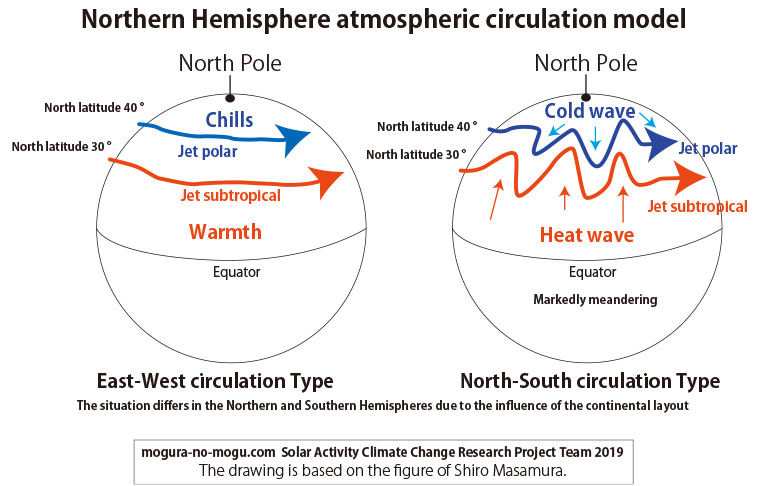
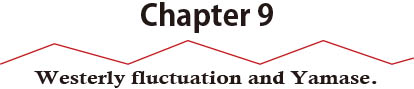
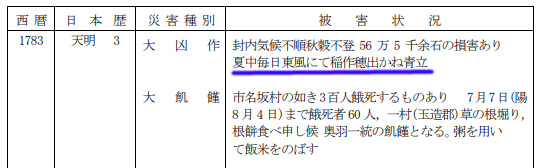
What is a westerly |
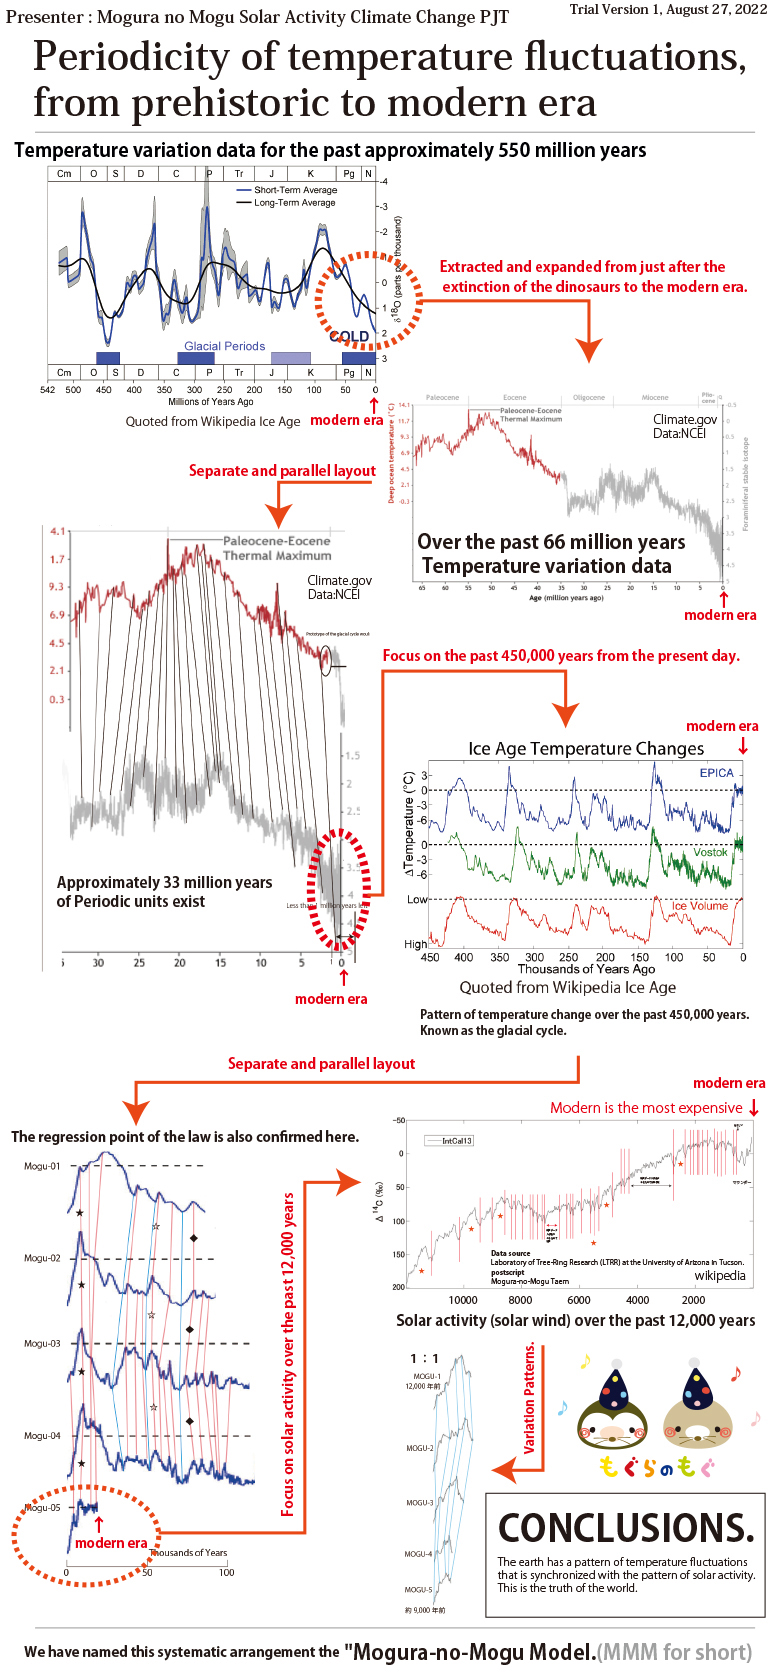
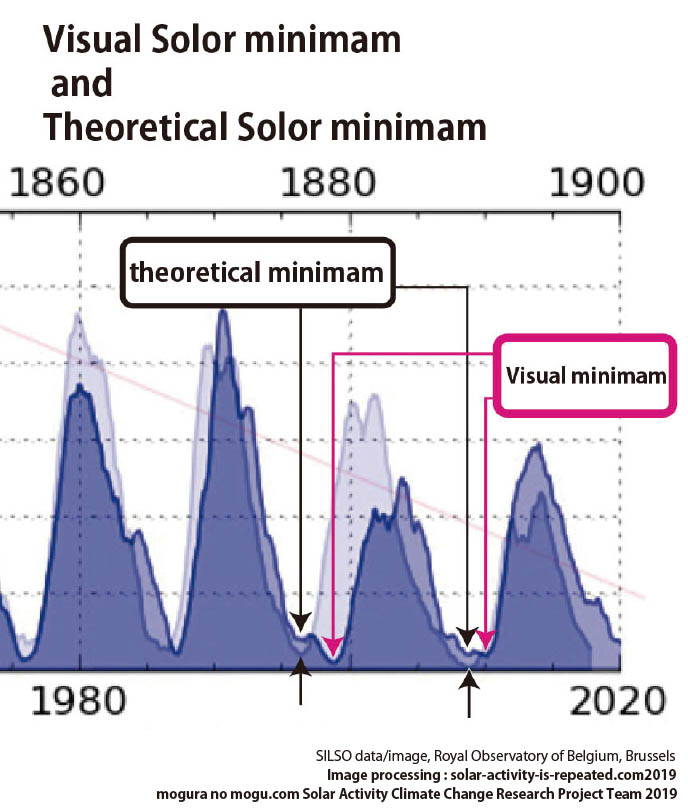
Professor Papamogu Let's take a look at this graph again.
Quoted from wikipedia
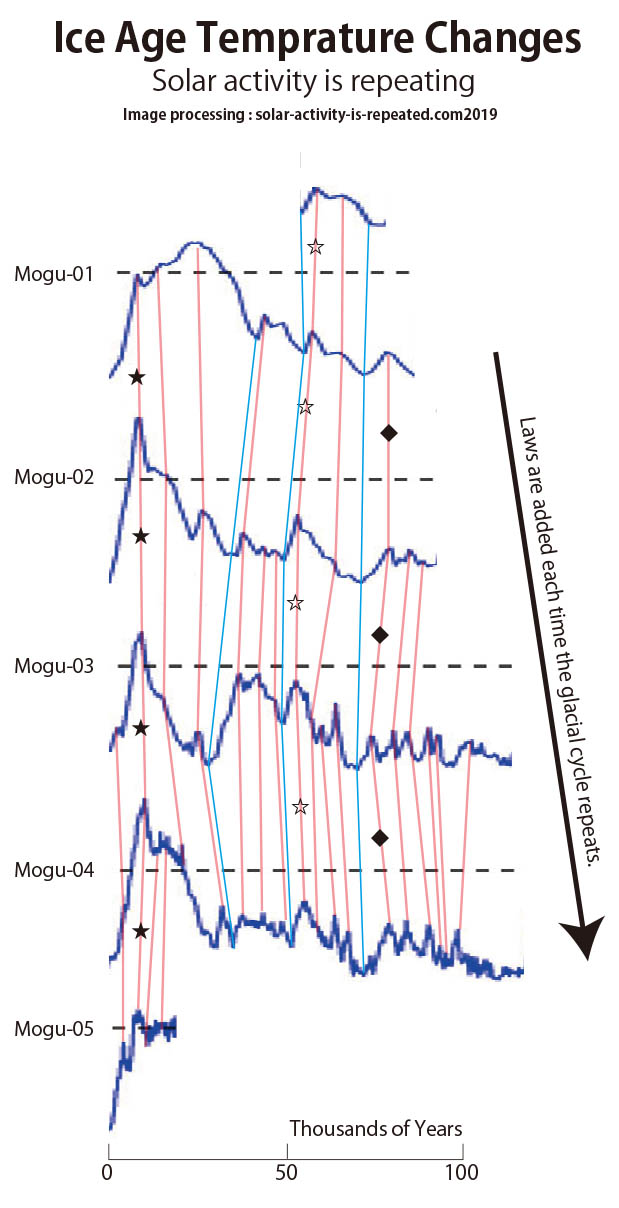
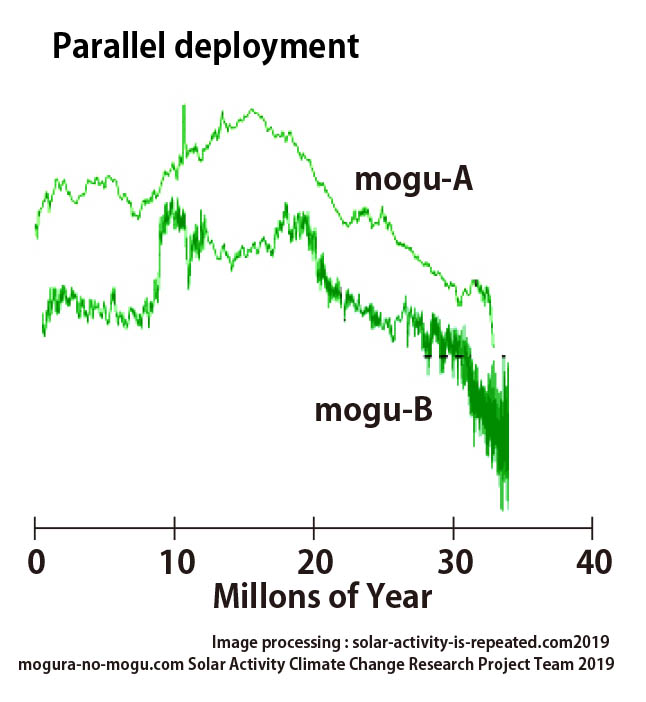
Let's arrange this graph in parallel and see how the law changes.
|
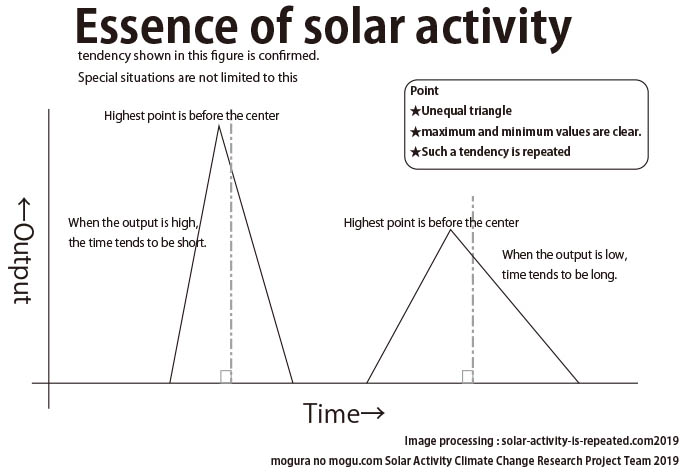
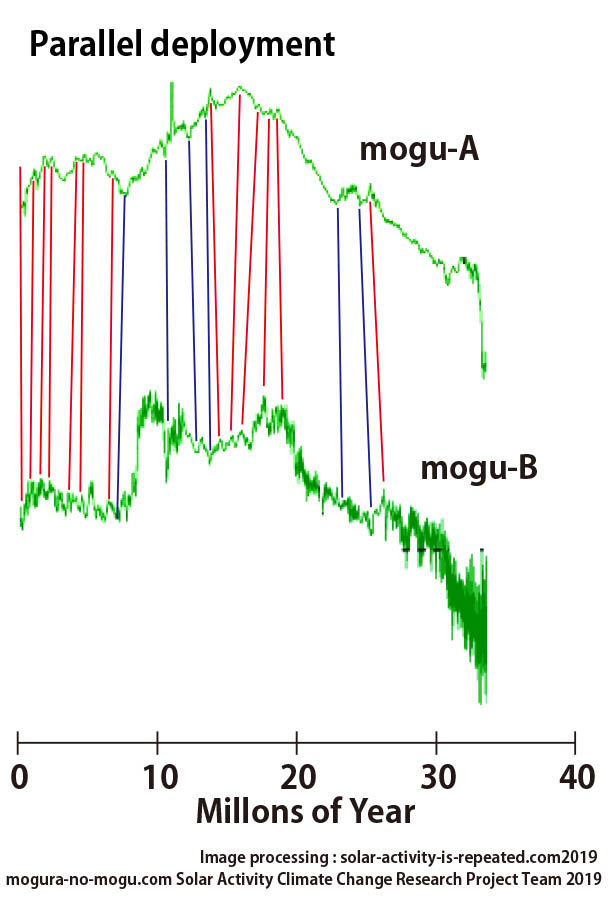
1: law is roughly maintained.2:There is fluctuation, but the original shape is kept.3: This is thought to be a repetition of solar activity. |
Most important point |
This understanding develops.
1: If you observe closely, you can clearly distinguish. |
The law of the 120-year cycle explained earlier is a law that occurred during the high activity period and is not considered to be permanent. |
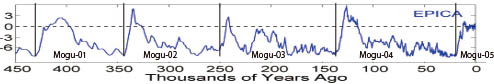
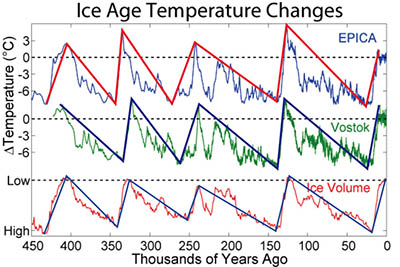
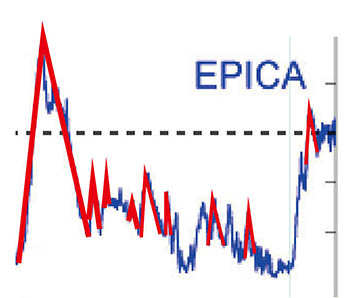
Based on this awareness, let's observe a graph of temperature changes over the past 5 million years. |
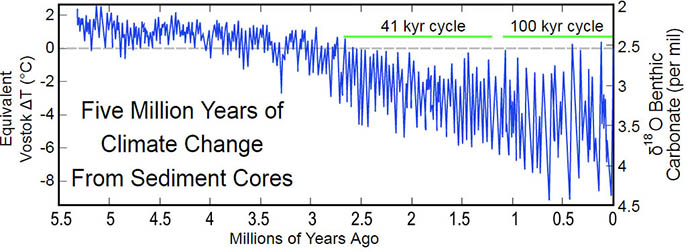
1: The laws are getting more complex as the times are newer. |
Dr. Kaerusan
|
Fluctuations are greater in the new era than in the old era.Kero. |
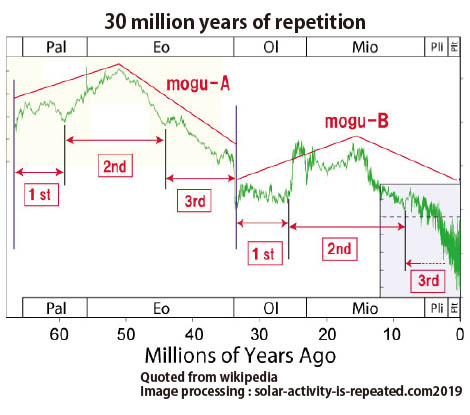
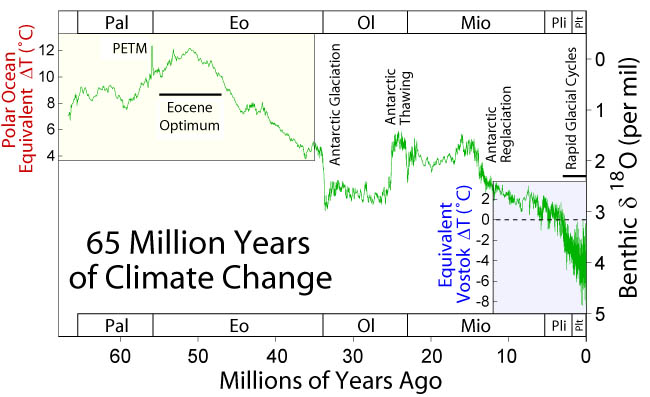
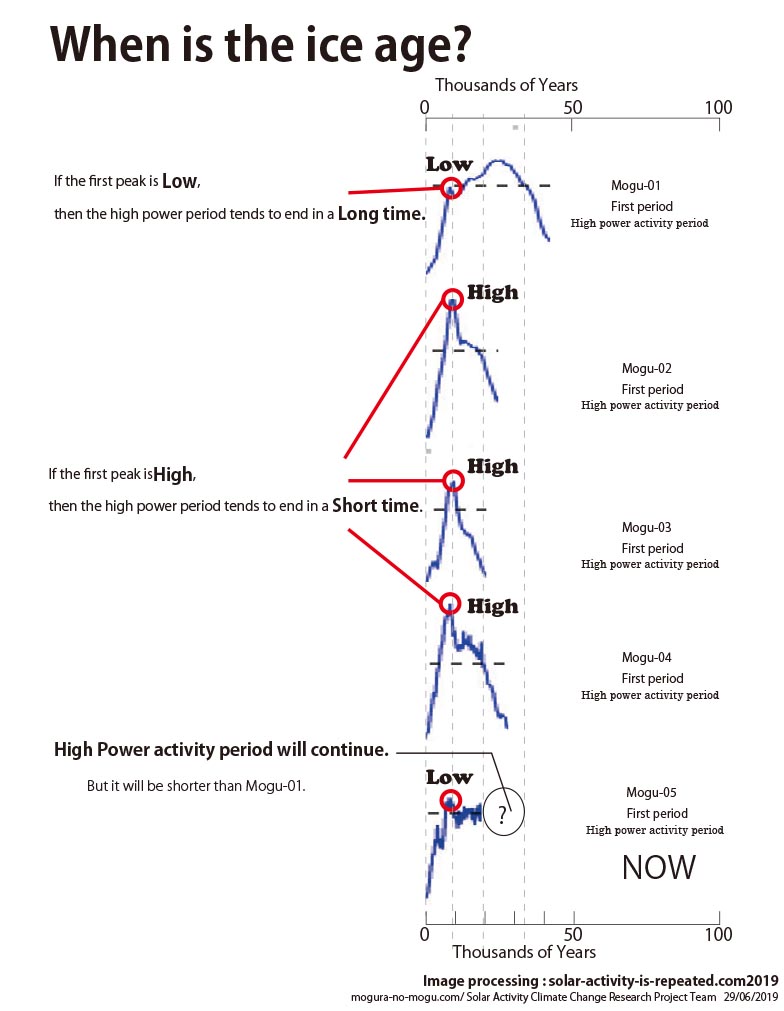
The activity period of about 32 million years is divided into three minor activity periods when observed closely.Kero.It seems to be at the end of an era that lasted about 32 million years.Kero. |
Supplementary data02
We think it will be a discovery that takes this understanding of the universe one step further. |
Professor Papamogu
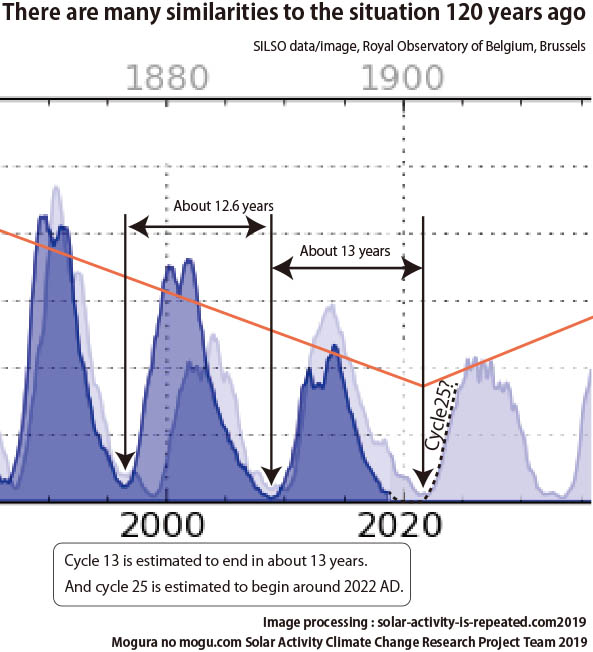
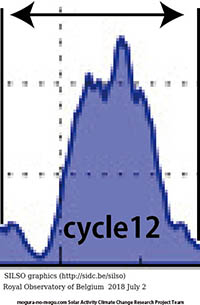
In other words, the true figure of cycle 12 is understood in this way.
|
Dr. Kaerusan
|
Please check with your own eyes.Kero.
|
Professor Papamogu
Dr. Kaerusan
original
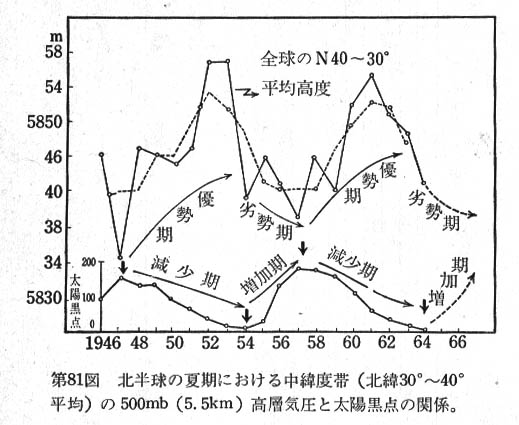
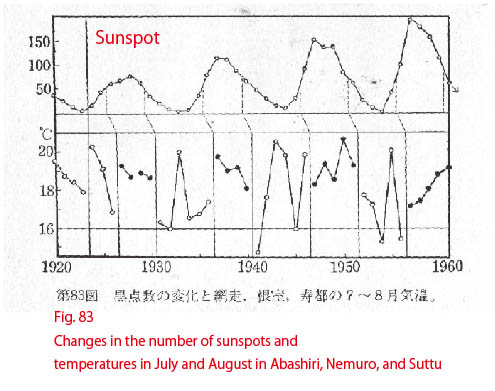
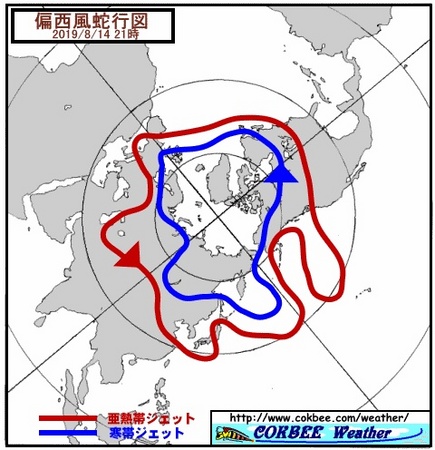
Fig.83
Quoted from https://www.cokbee.com/weather/jet.htm
We will supplement this understanding.Kero.
|
Professor Papamogu
Map data is quoted from Google Map
|
YAMASE has different durations and strengths from time to time.
|
Not yet complete
Please access again.
世界の皆さんへ
|
スペシャルサンクスではSILSOなど
別ウィンドウで参考文献
もぐらのもぐPR
|
||||||||||||||||||||||